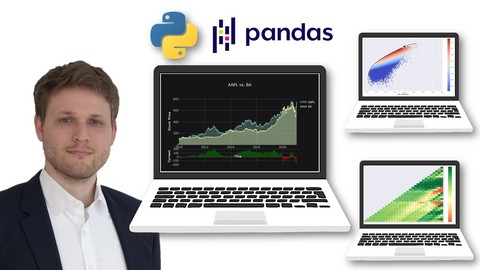
Overview of Manage Finance Data with Python & Pandas: Unique Masterclass Course on Udemy
Ready to step into the world of financial data analysis with Python? Manage Finance Data with Python & Pandas: Unique Masterclass is a one-of-a-kind course designed to help you analyze stocks, create portfolios, and optimize investments using Pandas, Numpy, Seaborn, and Plotly. With over 29 hours of video content, 200 coding exercises, and 8 downloadable resources, this course is led by Alexander Hagmann, a seasoned Data Scientist and Finance Professional with over 10 years of Fintech experience. It’s your ticket to mastering financial analytics.
Enroll today with coupon MANAGE_MAR25 (valid until March 31, 2025—check the offer box below for the discount link!) and unlock a wealth of practical skills.
What to Expect from the Manage Finance Data with Python & Pandas: Unique Masterclass Course
This 29+ hour course offers an immersive, hands-on learning experience tailored for finance professionals, students, and data enthusiasts. Alexander Hagmann’s teaching style is intuitive and practical, guiding you step-by-step with real data examples—no dry theory here. Expect 200 coding exercises, a final project where you advise a client’s portfolio, and flexible learning via Udemy’s platform, giving you lifetime access on any device.
What You Will Learn in Manage Finance Data with Python & Pandas: Unique Masterclass
Here’s what you’ll master by the end of this course:
- Stock Analysis: Analyze stocks with Pandas, Numpy, Seaborn, and Plotly.
- Portfolio Creation: Build and optimize indexes and portfolios (price-weighted, equal-weighted, value-weighted).
- Risk Metrics: Calculate Sharpe Ratio, Beta, Alpha, and systematic/unsystematic risk.
- Finance Theory: Understand Modern Portfolio Theory, CAPM, and Mean-Variance Optimization pitfalls.
- Rolling Statistics: Compute dynamic stats for deeper insights.
- Final Project: Step into a Financial Analyst role to advise on a client’s portfolio.
Why Choose This Manage Finance Data with Python & Pandas: Unique Masterclass Course on Udemy
Alexander Hagmann’s real-world Fintech expertise and focus on practical applications make this course exceptional. It’s packed with 29+ hours of video, 200 coding exercises, and 8 downloadable resources, offering unmatched depth for transitioning from Excel to Python. Its intuitive approach, even for beginners, ensures you grasp complex finance concepts through data. Use MANAGE_MAR25 to snag it at a discount (see offer box)!
Recommended Courses with Finance and Python Focus
Looking to expand your skills? Check out these related courses:
The Complete Pandas Bootcamp 2025: Data Science with Python
Complete 2-in-1 Python for Business and Finance Bootcamp
Algorithmic Trading A-Z with Python, Machine Learning & AWS Best seller
- The Complete Pandas Bootcamp 2025: Data Science with Python – 36+ hours mastering Pandas for data analysis.
- Python for Finance: Financial Investment and Data Analytics – 10+ hours on financial modeling with Python.
- Algorithmic Trading A-Z with Python, Machine Learning & AWS – 44+ hours on automated trading systems.
Our Review of Manage Finance Data with Python & Pandas: Unique Masterclass Course
From an admin perspective, this course stands out with its well-structured progression—from Pandas basics to advanced portfolio optimization. Alexander Hagmann’s clear, example-driven instruction and 10+ years of experience shine through, making it highly practical. The 200 coding exercises and final project ensure you can apply what you learn immediately.
Pros:
- Extensive 29+ hour curriculum with a real-world finance focus.
- Alexander’s expert, intuitive teaching style simplifies complex topics.
- 200 coding exercises and a final project boost hands-on skills.
Cons:
- May overwhelm absolute beginners without basic spreadsheet skills.
- Heavy finance focus might not appeal to pure data science learners.
With MANAGE_MAR25, it’s a steal!
Rating the Manage Finance Data with Python & Pandas: Unique Masterclass Course Experience
Overall Rating: 4.7/5
- Content: 4.8/5 – Comprehensive and practical, bridging finance and Python seamlessly.
- Delivery: 4.6/5 – Engaging and clear, though some sections are dense.
- Value: 4.7/5 – Affordable with MANAGE_MAR25, offering top-tier skills for the price.
Ready to master financial data? Enroll now and elevate your analytics game with Python and Pandas!


